
Whistler & Pemberton Market Update — June 2026
If you've been watching the Whistler and Pemberton markets and wondering whether now is finally a good time to buy, this month's update is for you.
Rather than leading with average sale prices — which in a low-volume market like Whistler and Pemberton can be heavily influenced by just a handful of sales in any given month — I'm focusing on the metric I actually use to read these markets: the sales-to-active-listings ratio.
It's simply the percentage of available homes that actually sold in a given month. When that number is high, buyers are competing hard and sellers have all the leverage. When it's low, buyers have more options and the balance shifts. And one thing I always watch for is consistency — one month doesn't make a trend. We need to be in the same territory for several consecutive months before we really feel the shift.
WHISTLER & PEMBERTON — MAY 2026
MARKET CONDITIONS
Whistler Overall 12% Balanced
Single Family 10% Buyers
Phase One (nightly rental) 16% Balanced
Pemberton 13% Balanced
PRICES — 2026 YTD vs 2022 PEAK
Whistler Overall $1.73M ⬇️ 5%
Single Family $4.01M ⬇️ 13%
Phase One (nightly rental) $1.88M ➡️ flat
Pemberton $939K ➡️ flat
Sales-to-active-listings ratio: below 12% = buyers market · 12–20% = balanced · 20%+ = sellers market
Prices based on full year 2022 vs 2026 year-to-date averages. One month doesn't make a trend — we need to be in the same territory for several consecutive months before we really feel the shift.
Whistler Market Update – May 2026
Year-over-Year (April 2026 vs. April 2025)
Whistler (All Property Types)
Active Listings: 285 (-9%)
Sales Volume: 29 (-12%)
Avg Sale Price: $2,013,724 (+35%)
Whistler Nightly Rental Properties (Phase 1)
Active Listings: 117 (+1%)
Sales Volume: 8 (-20%)
Avg Sale Price: $1,730,625 (+19%)
Whistler Single Family Homes
Active Listings: 67 (-21%)
Sales Volume: 8 (+60%)
Avg Sale Price: $4,216,750 (-6%)
Pemberton
Active Listings: 63 (+43%)
Sales Volume: 7 (0%)
Avg Sale Price: $821,143 (-25%)
Whistler Market Update – April 2026
Month-over-Month (March 2026 vs. February 2026)
Whistler (All Property Types)
Active Listings: 280 (0%)
Sales Volume: 35 (+30%)
Avg Sale Price: $1,514,414 (+4%)
Whistler Nightly Rental Properties (Phase 1)
Active Listings: 113 (+5%)
Sales Volume: 12 (+50%)
Avg Sale Price: $2,093,167 (+47%)
Whistler Single Family Homes
Active Listings: 76 (+7%)
Sales Volume: 2 (-33%)
Avg Sale Price: $3,085,000 (-37%)
Pemberton
Active Listings: 60 (+9%)
Sales Volume: 5 (-64%)
Avg Sale Price: $811,125 (-35%)
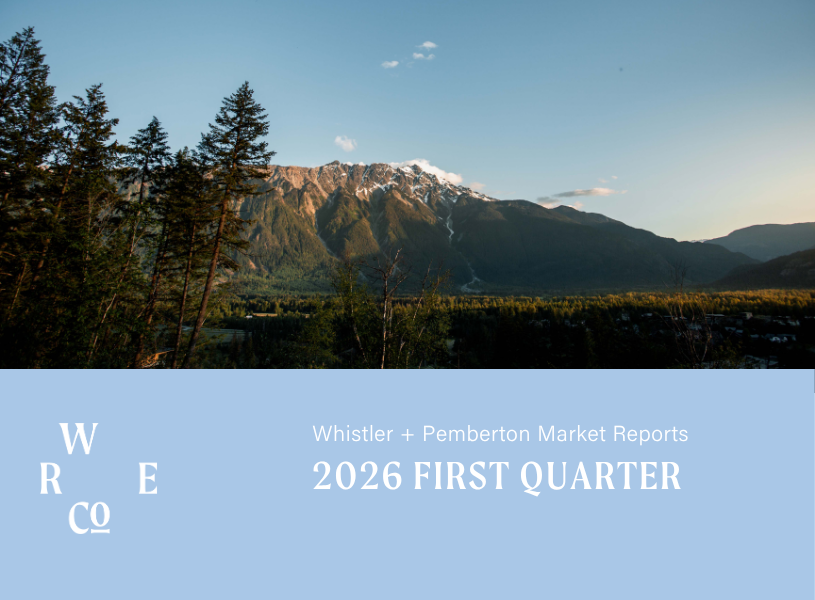
Real Estate Market Report – Q1 2026
Let’s talk about the Whistler and Pemberton real estate markets in the first quarter of 2026.
Whistler
While the first quarter of 2026 showed some improvement over the fourth quarter of 2025, it was weaker than the sales activity seen in Q1 2025. Listing levels compared to the same time last year were mixed, with slight increases in townhomes and condos, while chalet and shared ownership inventory saw marginal declines.
A closer comparison between Q1 2025 and 2026 suggests that uncertainty surrounding global economic and political conditions may be impacting buyer confidence. With the exception of the townhome segment, all other market segments experienced a decline in sales volume. Chalet, condo, and shared ownership sales decreased between 13% and 19%, while townhomes stood out with a 26% increase in sales activity. Total sales for the quarter reached 115 transactions. With a relatively small data set, it remains difficult to draw firm conclusions on overall market direction and buyer sentiment.
Whistler Market Update – March 2026
Year-over-Year (February 2026 vs. February 2025)
Whistler (All Property Types)
Active Listings: 280 (+3%)
Sales Volume: 27 (-29%)
Avg Sale Price: $1,451,815 (-31%)
Whistler Nightly Rental Properties (Phase 1)
Active Listings: 108 (+13%)
Sales Volume: 8 (-33%)
Avg Sale Price: $1,422,750 (-49%)
Whistler Single Family Homes
Active Listings: 71 (-14%)
Sales Volume: 3 (-57%)
Avg Sale Price: $4,866,667 (+8%)
Pemberton
Active Listings: 55 (+34%)
Sales Volume: 14 (+133%)
Avg Sale Price: $1,242,821 (+14%)
Month-over-Month (February 2026 vs. January 2026)
Whistler (All Property Types)
Active Listings: 280 (+6%)
Sales Volume: 27 (-23%)
Avg Sale Price: $1,451,815 (-21%)
Whistler Nightly Rental Properties (Phase 1)
Active Listings: 108 (+6%)
Sales Volume: 8 (-27%)
Avg Sale Price: $1,422,750 (-20%)
Whistler Single Family Homes
Active Listings: 71 (0%)
Sales Volume: 3 (-63%)
Avg Sale Price: $4,866,667 (+16%)
Pemberton
Active Listings: 55 (-11%)
Sales Volume: 14 (+1300%)
Avg Sale Price: $1,242,821 (+95%)

Whistler Market Update – February 2026
Year-over-Year (January 2026 vs. January 2025)
Whistler (All Property Types)
Active Listings: 263 (+1%)
Sales Volume: 35 (+6%)
Avg Sale Price: $1,844,871 (+50%)
Whistler Nightly Rental Properties (Phase 1)
Active Listings: 102 (+12%)
Sales Volume: 11 (+57%)
Avg Sale Price: $1,785,727 (-3%)
Whistler Single Family Homes
Active Listings: 71 (-5%)
Sales Volume: 8 (+60%)
Avg Sale Price: $4,205,000 (+21%)
Pemberton
Active Listings: 62 (+51%)
Sales Volume: 1 (-83%)
Avg Sale Price: $638,000 (-25%)
Whistler Market Update – January 2026
Year-over-Year (December 2025 vs. December 2024)
Whistler (All Property Types)
Active Listings: 267 (+2%)
Sales Volume: 35 (0%)
Avg Sale Price: $2,311,067 (+56%)
Whistler Nightly Rental Properties (Phase 1)
Active Listings: 96 (+7%)
Sales Volume: 17 (+42%)
Avg Sale Price: $3,274,431 (+51%)
Whistler Single Family Homes
Active Listings: 81 (+4%)
Sales Volume: 7 (+133%)
Avg Sale Price: $7,679,119 (+136%)
Pemberton
Active Listings: 57 (+33%)
Sales Volume: 6 (+20%)
Median Sale Price: $667,500 (-44%)
Real Estate Market Report – 2025 Year End
Let’s talk about the Whistler and Pemberton real estate markets in 2025.
Whistler
When looking at the year in totality, sales data shows that unit sales were down slightly, and total dollar volume declined marginally when compared to 2024. This market decline was almost exclusively concentrated in the condominium segment. Condo unit sales were down 17% year over year, while dollar volume decreased by 12%. These declines were partially offset by gains in other property types. Chalet sales increased by 7% in unit sales and 11% in dollar volume, while townhouse sales rose by 15% in units and 9% in dollar volume. Overall, the market was down 6% in total units sold, but only 1% in dollar volume, reflecting the higher price points of chalets and townhouses. Total listing volume was also down from 2024. However, of the new listings that entered the market, 53% sold within the year. If condos and vacant land are excluded, that figure rises to over 60%, indicating that buyers were actively engaged when the right product was available.

Whistler Market Update – December 2025
Month-over-Month (November 2025 vs. October 2025)
Whistler (All Property Types)
Active Listings: 264 (0%)
Sales Volume: 42 (-7%)
Avg Sale Price: $1,671,517 (-16%)
Whistler Nightly Rental Properties (Phase 1)
Active Listings: 104 (+3%)
Sales Volume: 18 (-5%)
Avg Sale Price: $2,003,373 (-17%)
Whistler Single Family Homes
Active Listings: 78 (0%)
Sales Volume: 7 (-22%)
Avg Sale Price: $3,718,714 (-20%)
Pemberton
Active Listings: 62 (+9%)
Sales Volume: 2 (-50%)
Avg Sale Price: $1,115,000 (-74%)

Whistler Market Update – November 2025
Month-over-Month (October 2025 vs. September 2025)
Whistler (All Property Types)
Active Listings: 264 (-12%)
Sales Volume: 45 (+25%)
Avg Sale Price: $1,987,689 (+59%)
Whistler Nightly Rental Properties (Phase 1)
Active Listings: 101 (-6%)
Sales Volume: 19 (+46%)
Avg Sale Price: $2,420,132 (+50%)
Whistler Single Family Homes
Active Listings: 78 (-18%)
Sales Volume: 9 (+125%)
Avg Sale Price: $4,665,556 (+78%)
Pemberton
Active Listings: 57 (-10%)
Sales Volume: 4 (+100%)
Avg Sale Price: $4,246,250 (+187%)

Real Estate Market Report – Q3 2025
Let’s talk about the third quarter of 2025 in the Whistler and Pemberton real estate markets.
Whistler
Sales activity in Whistler remained slow over the summer, with a total of 106* transactions recorded in Q3. This represents a 9% drop from Q2 and a modest 3% decline compared to the same quarter last year. Despite the slower pace, prices held stable across property types, including single-family homes, townhomes, and condos, when compared year over year. Overall inventory remained fairly consistent throughout the quarter and currently sits at 320* units, about 4% lower than this time last year. Despite total inventory across all product types remaining relatively consistent, there were different and notable trends within specific product categories – townhome inventory has declined by 22% year over year, while condo inventory is up 32% from last year. Within the condo market, Phase 2 (hotel-style) properties have seen inventory levels nearly double compared to last year, while Phase 1 (nightly rental) units have experienced a 20% increase. In terms of buyer origin, year-to-date data shows 86% of buyers are from B.C., slightly higher than the historical average in the low 80s, with an additional 8% of buyers coming from the U.S. The luxury segment remains active, with nine sales over $4 million in Q3. Of those, four sold for more than $5 million, including a top sale of $12.65 million. Overall, Q3 market conditions in Whistler were relatively balanced.

Whistler Market Update – October 2025
Month-over-Month (September 2025 vs. August 2025)
Whistler (All Property Types)
Active Listings: 300 (-2%)
Sales Volume: 36 (+16%)
Avg Sale Price: $1,246,375 (-34%)
Whistler Nightly Rental Properties (Phase 1)
Active Listings: 108 (-5%)
Sales Volume: 13 (+8%)
Avg Sale Price: $1,617,808 (-23%)
Whistler Single Family Homes
Active Listings: 95 (+7%)
Sales Volume: 4 (-33%)
Avg Sale Price: $2,617,500 (-26%)
Pemberton
Active Listings: 63 (+9%)
Sales Volume: 2 (-71%)
Avg Sale Price: $1,480,000 (+22%)

Whistler Market Update – September 2025
Month-over-Month (August 2025 vs. July 2025)
Whistler (All Property Types)
Active Listings: 307 (+3%)
Sales Volume: 31 (+7%)
Avg Sale Price: $1,899,364 (+1%)
Whistler Nightly Rental Properties (Phase 1)
Active Listings: 114 (0%)
Sales Volume: 12 (+100%)
Avg Sale Price: $2,094,667 (+69%)
Whistler Single Family Homes
Active Listings: 89 (-2%)
Sales Volume: 6 (+50%)
Avg Sale Price: $3,520,833 (-43%)
Pemberton
Active Listings: 58 (+14%)
Sales Volume: 7 (-30%)
Avg Sale Price: $1,216,643 (+36%)
Whistler Market Update – August 2025
Year-over-Year (July 2025 vs. July 2024)
Whistler (All Property Types)
Active Listings: 299 (-11%)
Sales Volume: 29 (-9%)
Avg Sale Price: $1,873,690 (-7%)
Whistler Nightly Rental Properties (Phase 1)
Active Listings: 114 (+13%)
Sales Volume: 6 (-40%)
Avg Sale Price: $1,240,500 (-45%)
Whistler Single Family Homes
Active Listings: 91 (-3%)
Sales Volume: 4 (-43%)
Avg Sale Price: $6,137,750 (+62%)
Pemberton
Active Listings: 51 (-29%)
Sales Volume: 10 (+43%)
Avg Sale Price: $896,700 (-10%)

Real Estate Market Report – Q2 2025
Let’s talk about the second quarter of 2025 in the Whistler and Pemberton real estate markets.
Whistler
The Whistler real estate market continued its slower pace into the second quarter of 2025, with 111* total sales, marking a slight decline from Q1 and approximately 20% fewer sales year-to-date compared to mid-2024. May emerged as the busiest month of the year thus far, accounting for over 40% of the quarter’s activity. The luxury segment (sales over $4M) remained active, with 8 of the 17 year-to-date luxury sales occurring in Q2. There were 53% more townhome sales and 60% fewer condo sales than in the same period last year. Overall, the median sale price for the market in May and June was at its highest since July 2024. However, properties took longer to sell across all categories compared to the same period last year. Single-family homes had a median of 87 days on market, up 60%, while condos and townhomes doubled their median days to sell, reaching 49 and 59 days, respectively. Inventory levels remained relatively stable, with an average of 337 active listings* throughout the quarter—a slight decrease from the same period last year. Year-to-date buyer origin remained consistent with historical trends. 67% of purchasers were from Whistler, Vancouver, or the North Shore, with another 18% from the rest of BC. International buyers made up 12% of the market, three-quarters of whom were from the U.S.

Whistler Market Update – first half of 2025
1st Half of 2025 vs. 1st Half of 2024
Whistler (All Property Types)
Active Listings: 317 (-5%)
Sales Volume: 216 (-20%)
Avg Sale Price: $1,733,857 (flat)
Whistler Nightly Rental Properties (Phase 1)
Active Listings: 120 (+8%)
Sales Volume: 76 (-19%)
Avg Sale Price: $1,932,312 (-6.5%)
Whistler Single Family Homes
Active Listings: 247 (-2%)
Sales Volume: 33 (-11%)
Avg Sale Price: $4,036,227 (-7%)
Pemberton
Active Listings: 73 (-22%)
Sales Volume: 45 (-12%)
Avg Sale Price: $1,045,711 (flat)

Whistler Market Update – June 2025
Year-over-Year (May 2025 vs. May 2024)
Whistler (All Property Types)
Active Listings: 319 (-2%)
Sales Volume: 42 (-13%)
Average Sale Price: $1,583,593 (-2%)
Whistler Nightly Rental Properties (Phase 1)
Active Listings: 108 (-3%)
Sales Volume: 18 (+80%)
Average Sale Price: $1,749,778 (-2%)
Whistler Single Family Homes
Active Listings: 94 (+16%)
Sales Volume: 6 (-40%)
Average Sale Price: $2,360,833 (-46%)
Pemberton
Active Listings: 48 (-35%)
Sales Volume: 8 (-20%)
Average Sale Price: $1,055,937 (+1%)
Month-over-Month (May 2025 vs. Apr 2025)
Whistler (All Property Types)
Active Listings: 319 (+2%)
Sales Volume: 42 (+35%)
Average Sale Price: $1,583,593 (+5%)
Whistler Nightly Rental Properties (Phase 1)
Active Listings: 108 (-5%)
Sales Volume: 18 (+80%)
Average Sale Price: $1,749,778 (+20%)
Whistler Single Family Homes
Active Listings: 94 (+11%)
Sales Volume: 6 (+20%)
Average Sale Price: $2,360,833 (-47%)
Pemberton
Active Listings: 48 (+9%)
Sales Volume: 8 (+33%)
Average Sale Price: $1,055,937 (-5%)

Whistler Market Update – May 2025
Year-over-Year (Apr 2025 vs. Apr 2024)
Whistler (All Property Types)
Active Listings: 314 (+6%)
Sales Volume: 31 (-50%)
Avg Sale Price: $1,503,777 (+12%)
Whistler Nightly Rental Properties (Phase 1)
Active Listings: 114 (+28%)
Sales Volume: 10 (-57%)
Avg Sale Price: $1,452,800 (-9%)
Whistler Single Family Homes
Active Listings: 85 (+6%)
Sales Volume: 5 (+25%)
Avg Sale Price: $4,473,000 (-7%)
Pemberton
Active Listings: 44 (-23%)
Sales Volume: 6 (-54%)
Avg Sale Price: $1,109,167 (+2%)
Month-over-Month (Apr 2025 vs. Mar 2025)
Whistler (All Property Types)
Active Listings: 314 (+2%)
Sales Volume: 31 (+3%)
Avg Sale Price: $1,503,777 (-28%)
Whistler Nightly Rental Properties (Phase 1)
Active Listings: 114 (+6%)
Sales Volume: 10 (-29%)
Avg Sale Price: $1,452,800 (-35%)
Whistler Single Family Homes
Active Listings: 85 (-8%)
Sales Volume: 5 (+25%)
Avg Sale Price: $4,473,000 (-23%)
Pemberton
Active Listings: 44 (0%)
Sales Volume: 6 (-14%)
Avg Sale Price: $1,109,167 (+17%)

Whistler Market Update – april 2025
Year-over-Year (Mar 2025 vs. Mar 2024)
Whistler (All Property Types)
Active Listings: 308 (+12%)
Sales Volume: 30 (-30%)
Avg Sale Price: $2,075,397 (+4%)
Whistler Nightly Rental Properties (Phase 1)
Active Listings: 108 (+32%)
Sales Volume: 12 (-14%)
Avg Sale Price: $2,057,825 (-24%)
Whistler Single Family Homes
Active Listings: 92 (+16%)
Sales Volume: 4 (-33%)
Avg Sale Price: $5,823,750 (+30%)
Pemberton
Active Listings: 44 (-27%)
Sales Volume: 7 (-22%)
Avg Sale Price: $946,214 (-14%)
Month-over-Month (Mar 2025 vs. Feb 2025)
Whistler (All Property Types)
Active Listings: 308 (+14%)
Sales Volume: 30 (-21%)
Avg Sale Price: $2,075,397 (-1%)
Whistler Nightly Rental Properties (Phase 1)
Active Listings: 108 (+15%)
Sales Volume: 12 (no change)
Avg Sale Price: $2,057,825 (-26%)
Whistler Single Family Homes
Active Listings: 92 (+11%)
Sales Volume: 4 (-43%)
Avg Sale Price: $5,823,750 (+29%)
Pemberton
Active Listings: 44 (+7%)
Sales Volume: 7 (+40%)
Avg Sale Price: $946,214 (-8%)

Real Estate Market Report – Q1 2025
Let’s talk about the first quarter of 2025 in the Whistler and Pemberton real estate markets.
Whistler
The Whistler market is off to a slower start this year, with 106* sales in the quarter, down 23% from the 130* sales in Q1 last year. Despite slower sales, there was an uptick in the number of single-family homes sold in Q1 vs Q4 of last year. Inventory continued to rise through the quarter, with a total of 241* listings coming to the market. Overall inventory currently sits at 326* units, up 21% from the end of 2024 and 12% from the same time last year. The median sale price was up vs Q4 across the single family, townhome and condo categories.